

Dashboard
Read the Clics Overview: KPIs, trends, traffic breakdowns, goals, custom events, and the yearly activity heatmap.
The Overview is your project home in the Clics dashboard. Open a project and environment to see traffic, sources, and conversions for the selected date range.
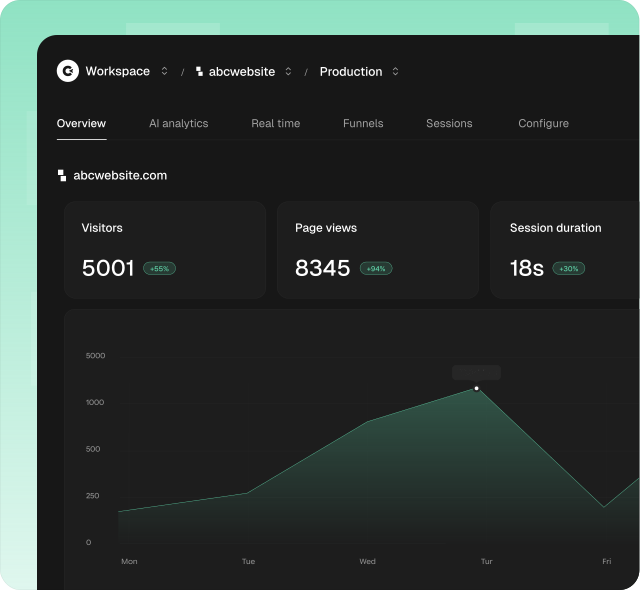
What you see on Overview
Top to bottom:
- Site header: favicon, website URL, and live active visitors right now
- Filter and date range: scope every chart and card on the page
- KPI tabs + trend chart: Visitors, Page views, Session duration, Bounce rate (with change vs the previous period)
- Breakdown cards: Pages, referrers/UTMs, countries, devices, browsers, and operating systems
- Goals and Events cards: conversion rates and top custom events
- Activity heatmap: yearly visitors or page views by day
If the project has never received events, Overview shows a short install guide instead: add the tracker, then visit your site.
KPI tabs
| Metric | Meaning |
|---|---|
| Visitors | Unique visitors in the range |
| Page views | Total pageviews |
| Session duration | Average time per visit |
| Bounce rate | Share of single-pageview sessions |
Click a tab to switch the trend chart and the column headers on breakdown cards. Totals include a % change vs the previous period (hidden for All Time).
Goal mode
From Filter, pick a Goal. Overview switches to conversion KPIs:
- Unique conversions
- Total conversions
- Conversion rate
Breakdown cards then show Conversions and Rate instead of visitors/page views. Clear the goal filter to return to traffic metrics. See Goals.
Breakdown cards
| Card | What it answers |
|---|---|
| Pages / Hostnames | Which paths and hosts get traffic |
| Referrers / UTM | Where traffic comes from (source, medium, campaign, term, content) |
| Countries | Geographic distribution |
| Devices / Browsers | Device and browser mix |
| Operating systems | OS breakdown |
Empty state: No data for this period. Expand a card when there are more than a few rows.
Goals and Events cards
- Goals: visitors, total conversions, and rate per goal. Empty state links to Configure → Goals.
- Events: top custom events from
track(). Requires a paid plan; otherwise you see an upgrade prompt. Setup: Custom Events.
Activity heatmap
The heatmap shows Visitors activity or Page views activity for the year. Toggle the metric and, when relevant, filter by hostname.
Date range and filters
Date presets: Last 24 hours, Last 7 days, Last 30 days, Last 3 months, Last 12 months, Month / Quarter / Year to Date, All Time, or a custom range. Default is Last 7 days.
Filter dimensions: Country, Device, Browser, OS, Page, Hostname, Referrer, Event, UTM fields, and Goal. Operators are is / is not (except Event). Empty referrer = Direct / none. Active filters appear as chips; Escape clears them.
Filters apply across Overview charts and cards for the selected environment.
Project tabs
From the project nav (siblings of Overview):
| Tab | Use it for |
|---|---|
| AI Analytics | Referrals from ChatGPT, Claude, Perplexity, Gemini, Copilot: guide |
| Realtime | Who is on the site right now: guide |
| Funnels | Multistep drop-off: guide |
| Sessions | Individual visit journeys: guide |
| Configure | Tracking snippet, goals, and usage |
Each project has production and development environments. Goals and funnels are scoped per environment: use development to test tracking before going live.
Configure
Under Configure:
- Tracking: install snippet and verify domains
- Goals: page and event conversion goals
- Usage: workspace event volume